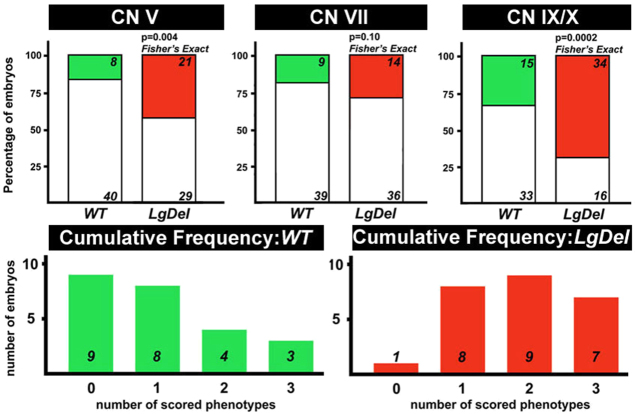
Fig. 6. Statistically significant changes in phenotypic frequency in developing CN V, IX and X in LgDel versus WT embryos. Top panels: histograms showing the proportion of WT (green) and LgDel (red) embryos with each of the three phenotypes scored (CN V, VII and IX/X). Statistical significance determined using Fisher’s exact analysis. The CN V and IX/X phenotypes occur at significantly greater frequency than in the WT; the CN VII phenotype does not. Lower panels: frequency of single or multiple CN phenotypes in WT and LgDel embryos. Overall phenotypic frequency is substantially increased in LgDel mice, as is the number of individual embryos showing multiple (two or three) CN phenotypes.
Image published in: Karpinski BA et al. (2014)
© 2014. Creative Commons Attribution license
Permanent Image Page
Printer Friendly View
XB-IMG-136745